Electric Data Solutions provides a range of services including custom reports, bespoke software development, data integration, and interactive visualizations.
Our analytical tools help you to better understand your unique contribution to the global research system, identify trends, spot talent, predict change, and plan for future success.
Topic Modelling
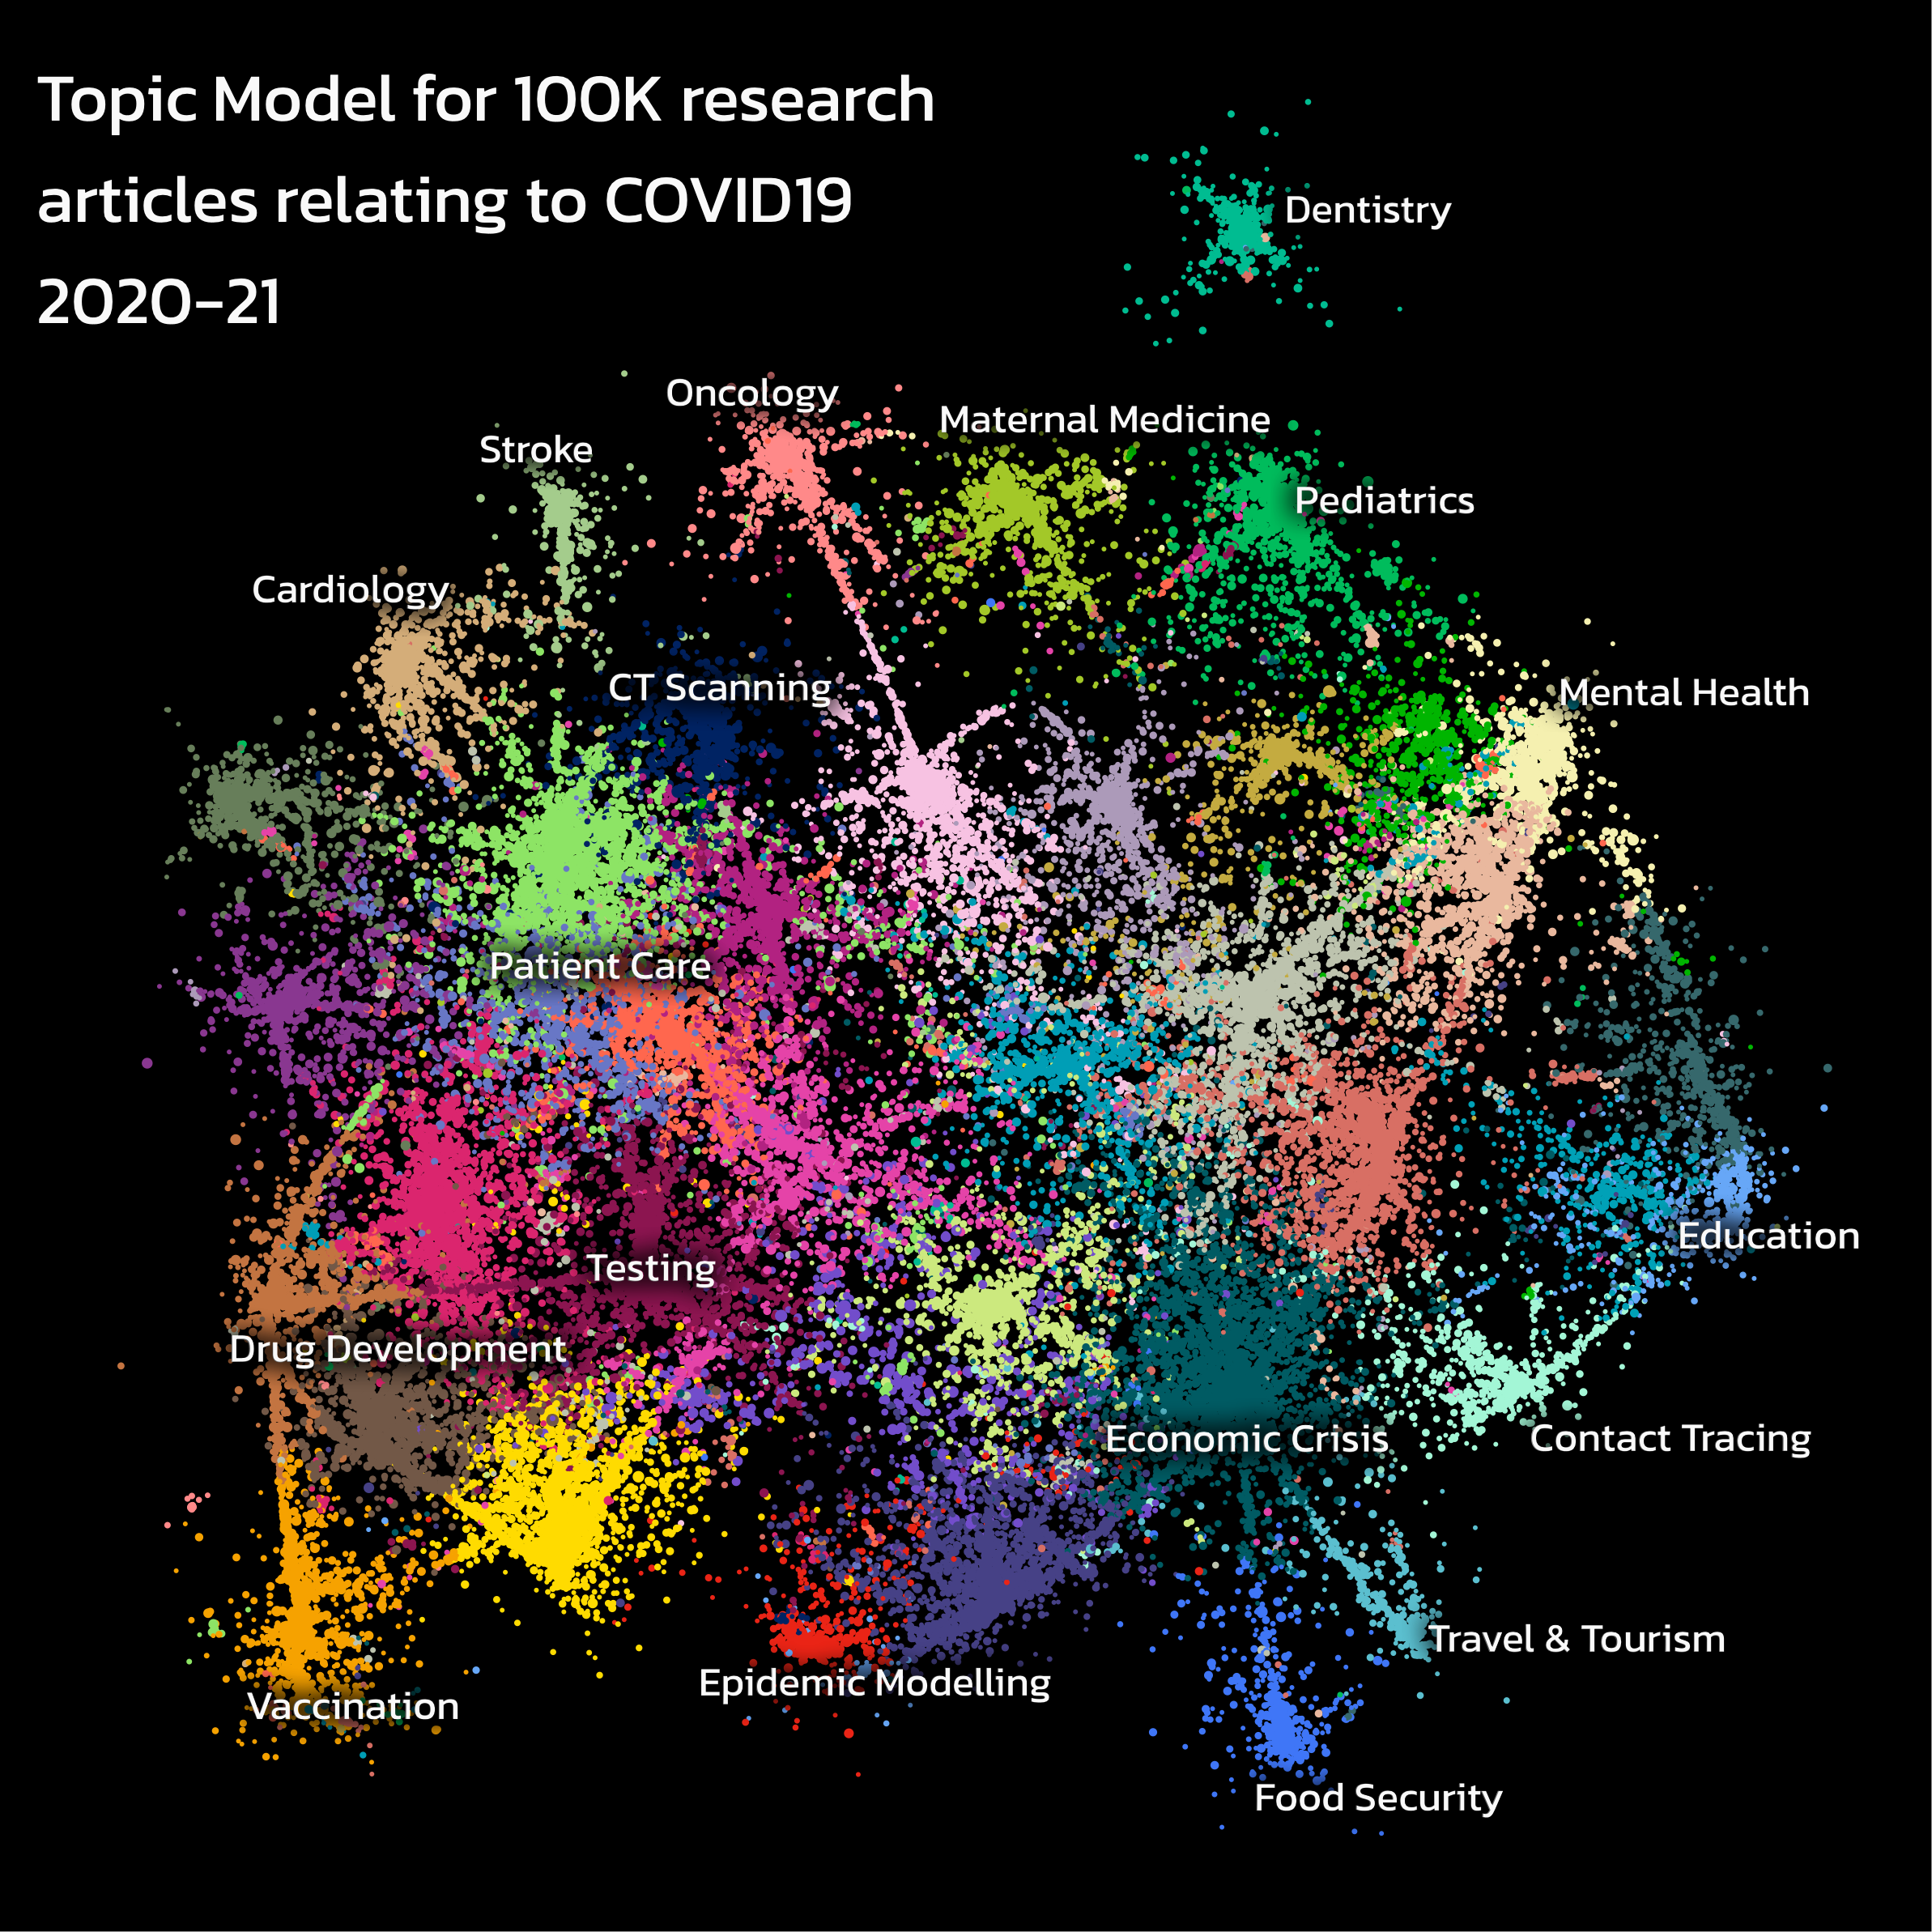
Topic modelling is a language processing technique that can be applied to large document sets to understand the different combinations of words or phrases (topics) that are present. It is especially effective when used on short descriptive texts that are often found in research datasets and is useful when data are not categorised using a formal taxonomy.
We use topic modelling when examining research portfolios to help you discover relevant research themes such as target demographics, technology application domains, and methodology types.
Network Analysis
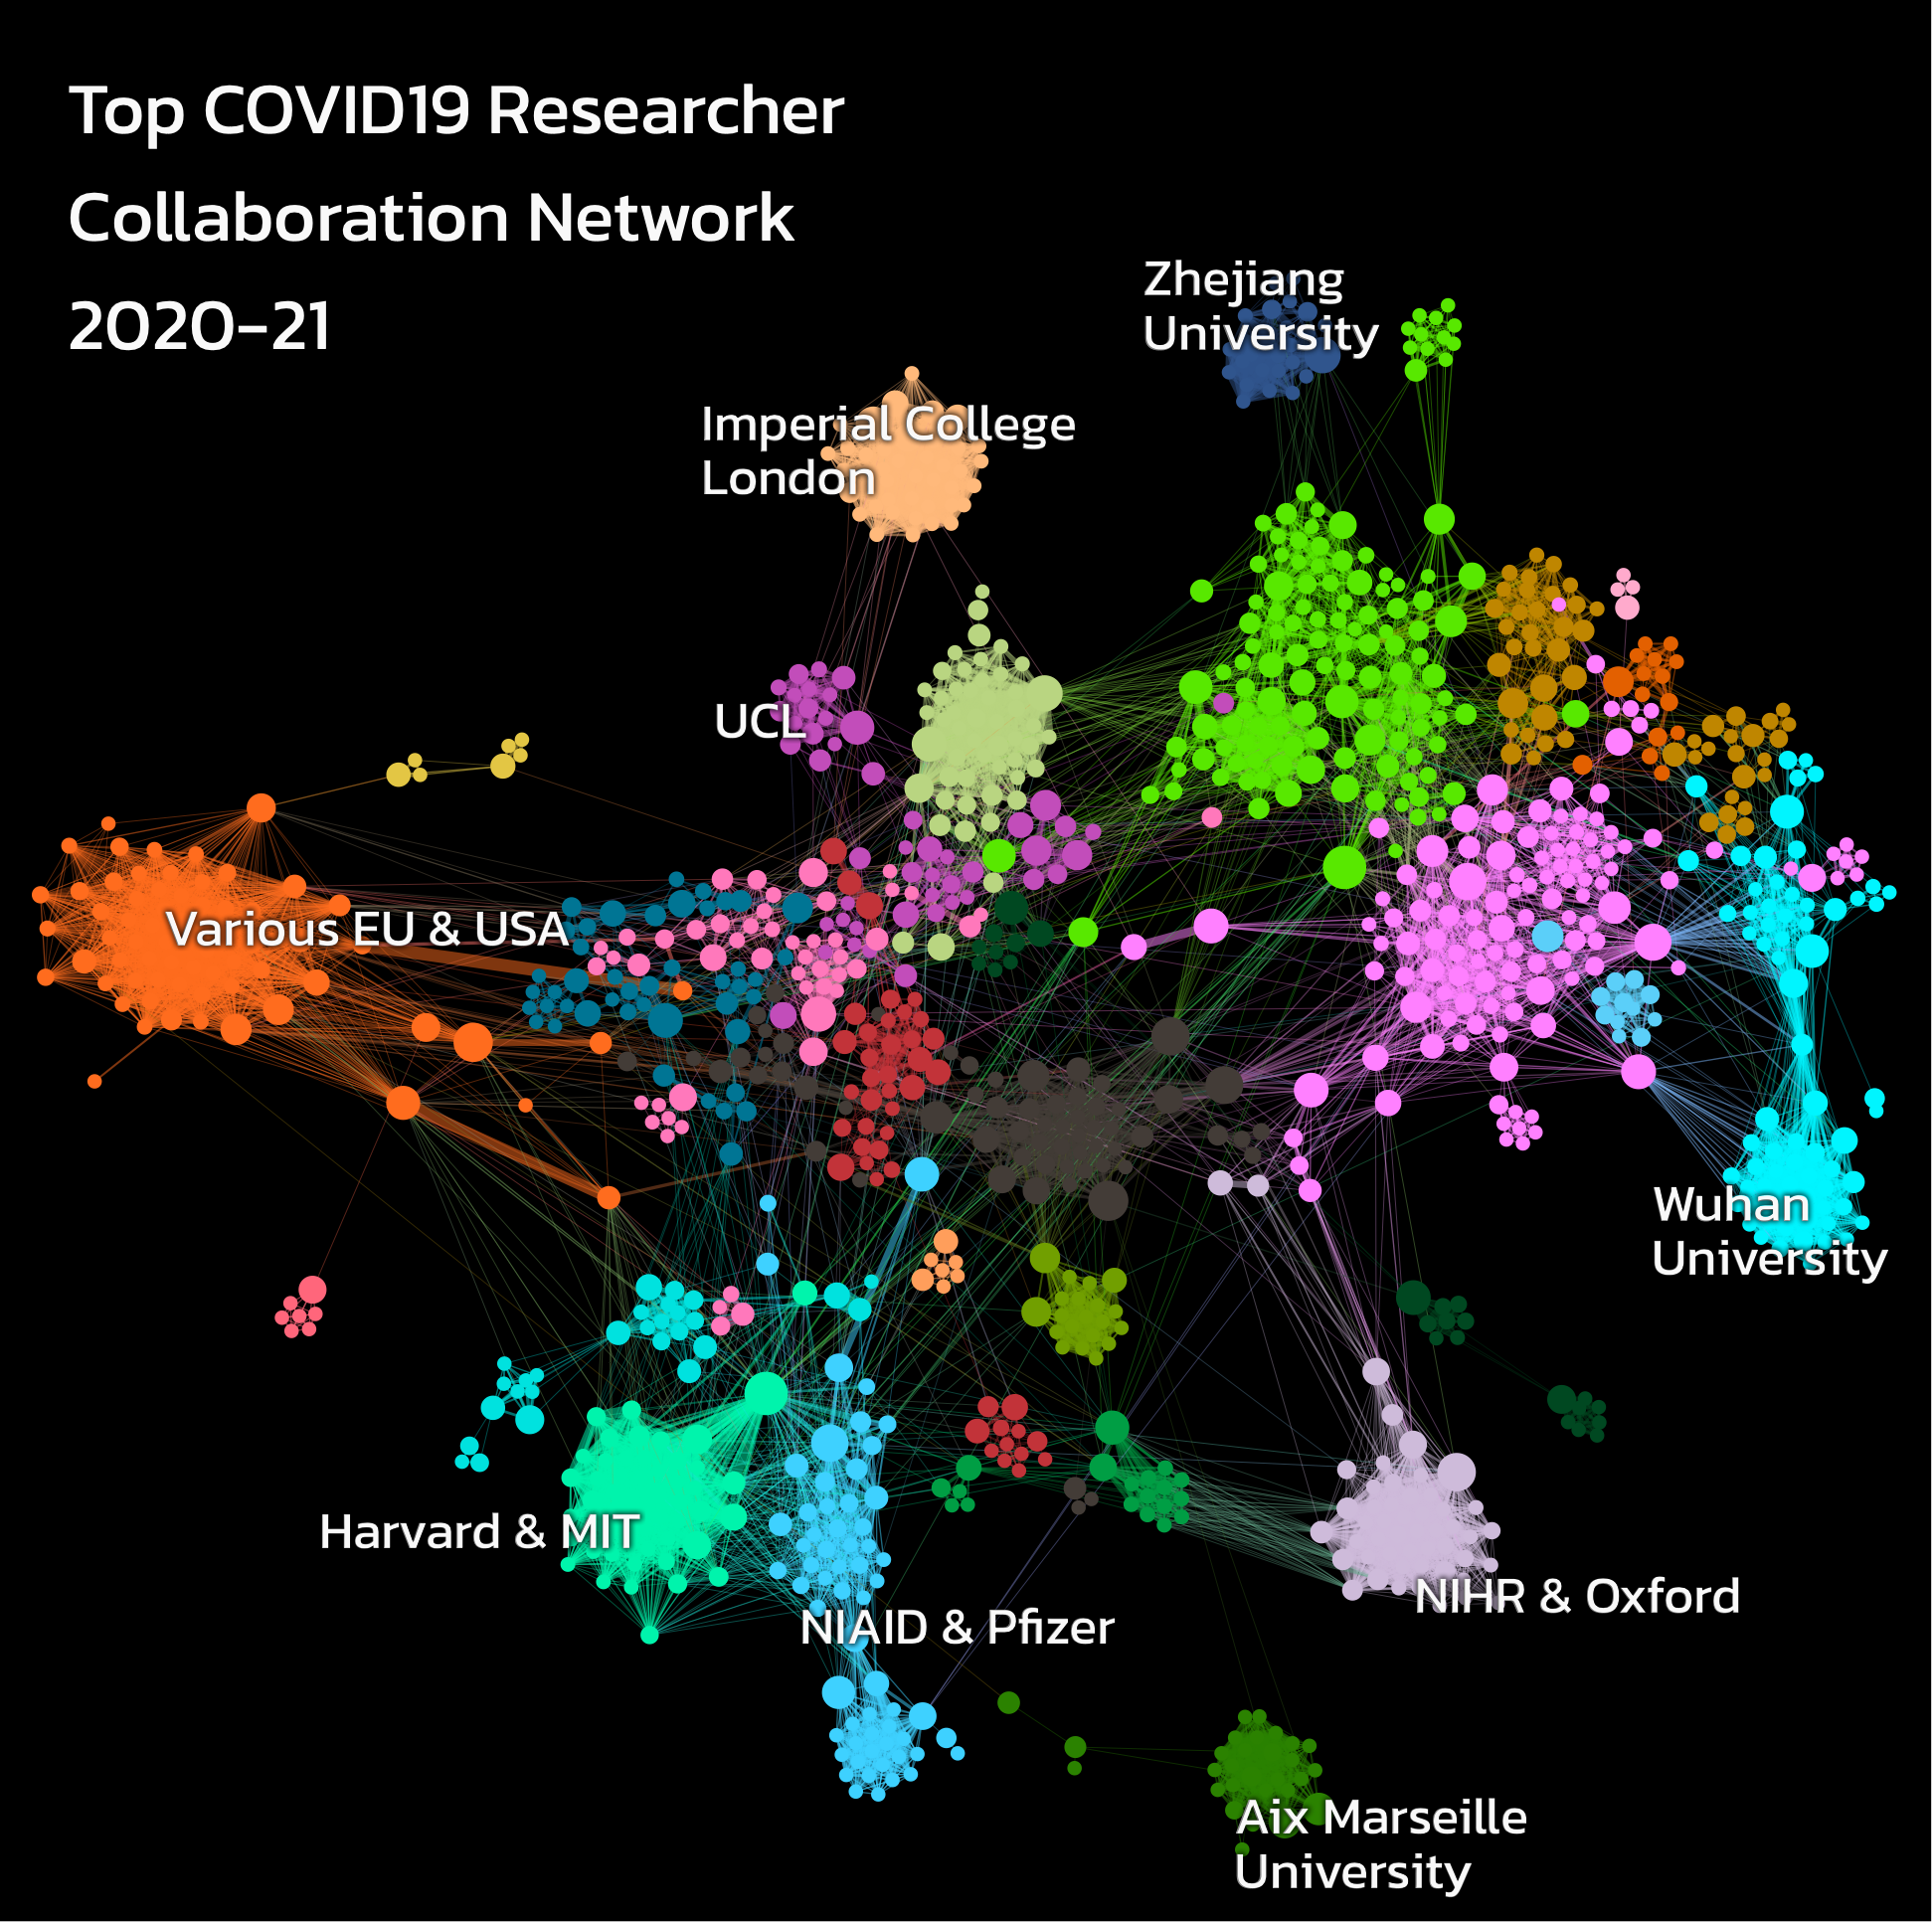
Network analysis is a valuable tool that can help you understand the structure and dynamics of research systems. We utilise a range of standard and custom bibliometric indicators, develop custom algorithms, and integrate a variety of data sources to demonstrate how research is conducted and utilized.
This kind of information is useful to research managers as it helps them measure and compare their research capability, recognise potential growth opportunities, and plan future investment.
Data Enhancement
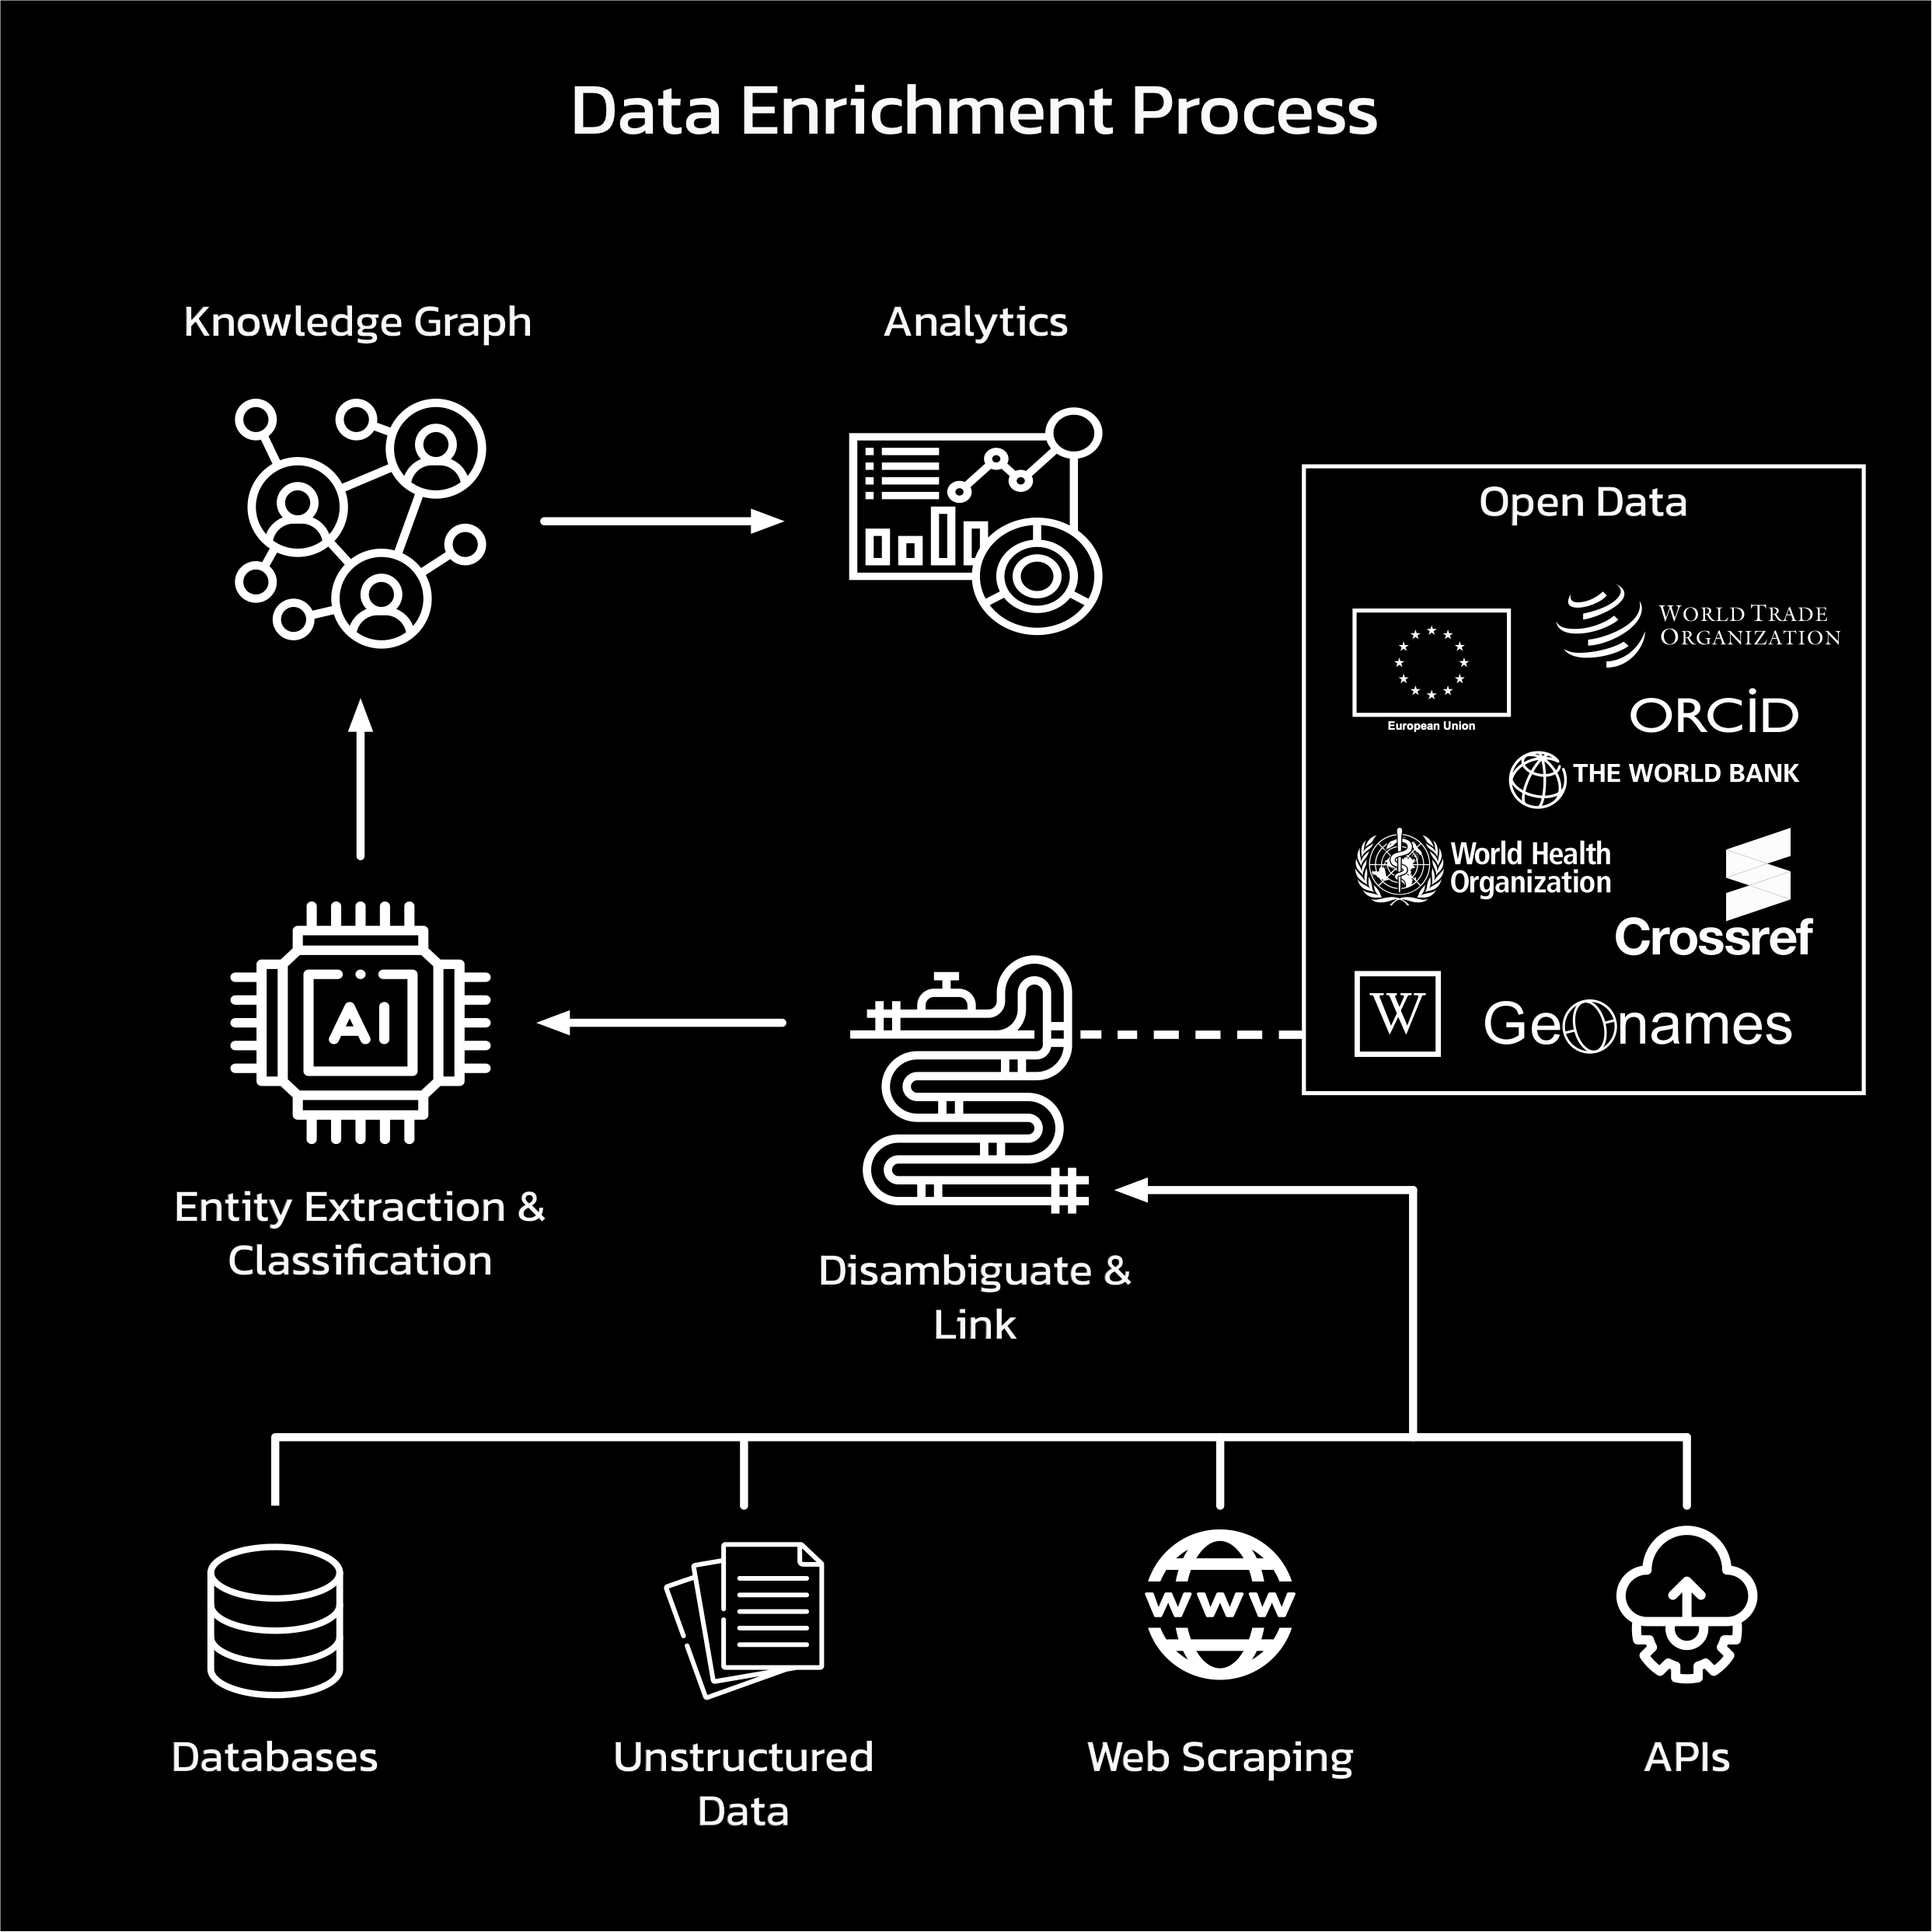
Data is often collected from multiple sources, many of which can be linked and enhanced using data science tools such as entity extraction and machine learning classification. Our expertise in knowledge graphs enable us to join large, complex datasets which can be used to create reports, run analytical products, or produce custom applications.
We also offer data cleaning and disambiguation services to help customers integrate a wide range of information into their own databases, making use of public identifiers and open data where possible to increase interoperability and reduce costs.
Visualization
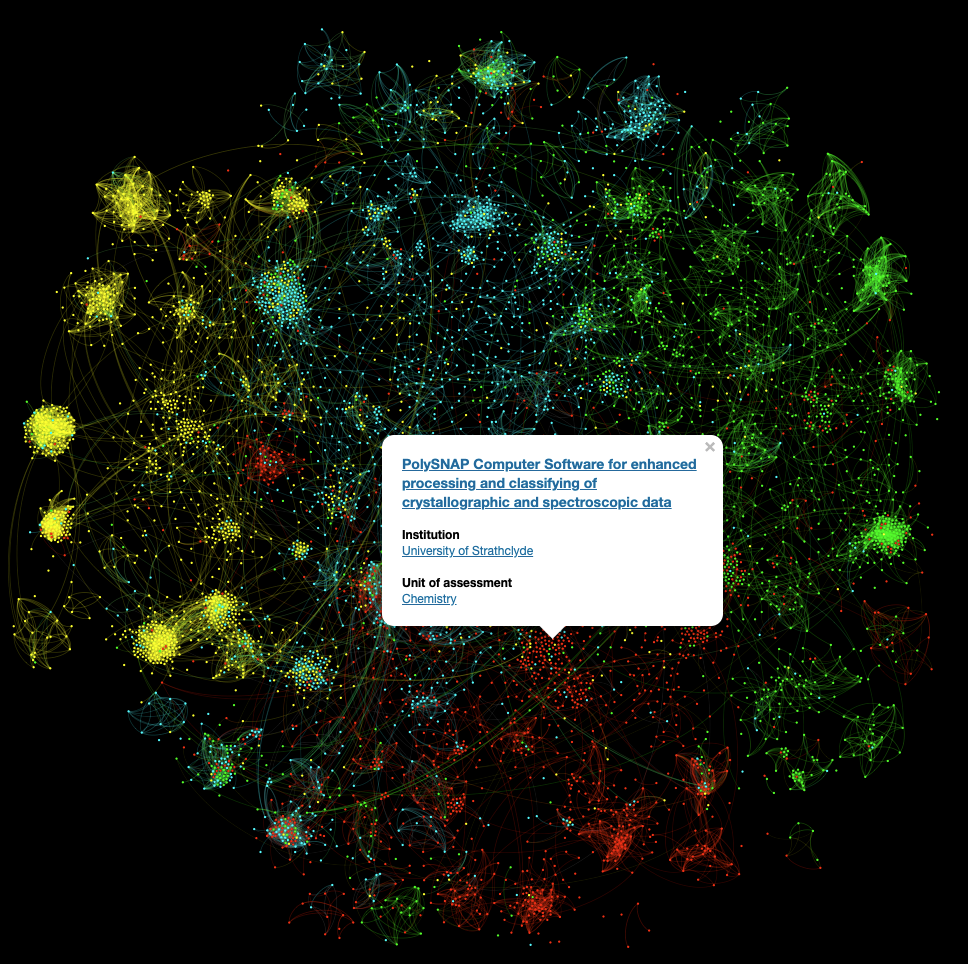
Visualization is an important tool to communicate the results of an analysis in an accessible format. Sometimes, this is best achieved using simple bar charts or line graphs, but for more complex tasks, sophisticated tools are needed to organize the data in a meaningful way. Interactive features can also help users engage more actively with the data enabling them to discover trends and interesting outcomes for themselves.
We use the latest machine learning tools to help us turn complicated data into recognisable and usable structures that aid in interpretation giving you and your stakeholders a better understanding of analytical outcomes.
Previous Reports
In previous roles, our Chief Scientist, Martin Szomszor has written numerous reports on issues relating to research evaluation and scholarly publication, as listed below:
2021- ISI Global Research Report: Subject diversity in research portfolios
- ISI Global Research Report: The changing research landscape of the Middle East, North Africa and Turkey
- ISI Global Research Report: Data categorization: understanding choices and outcomes
- ISI Global Research Report: The Annual G20 Scorecard – Research Performance 2020
- ISI Global Research Report: Research Integrity: Understanding our shared responsibility for a sustainable scholarly ecosystem
- ISI Global Research Report: Identifying Research Fronts in the Web of Science: From Metrics to Meaning
- ISI Global Research Report: The value of bibliometric databases
- ISI Global Research Report: Multi-authorship and research analytics
- ISI Global Research Report: South and East Asia
- ISI Global Research Report: The Annual G20 Scorecard
- ISI Global Research Report: Navigating the Structure of Research on Sustainable Development Goals
- ISI Global Research Report: The Plan S Footprint
- ISI Global Research Report: Profiles, Not Metrics
- Digital Research Report: Unraveling the Engagement and Impact of Academic Research
- Digital Research Report: Topic Modelling of Research in the Arts and Humanities
- Digital Research Report: Discovery and Analysis of Global Research Trends Using GRID
- Digital Research Yearbook: UK Higher Education
- Digital Research Report: Examining Implications of Brexit for the UK Research Base
- Digital Research Report: Interdisciplinary Research - Methodologies for Identification and Assessment
- Digital Research Report: The Societal and Economic Impacts of Academic Research
- Digital Research Report: The Diversity of UK Research and Knowledge - Analyses from the REF impact case studies